Know every customer. Optimise every decision. Protect every store.
Turn the cameras you already have into accurate foot traffic, queue, dwell and customer journey data — across one store or a national network.
Know every customer. Optimise every decision. Protect every store.
Turn the cameras you already have into accurate foot traffic, queue, dwell and customer journey data — across one store or a national network.
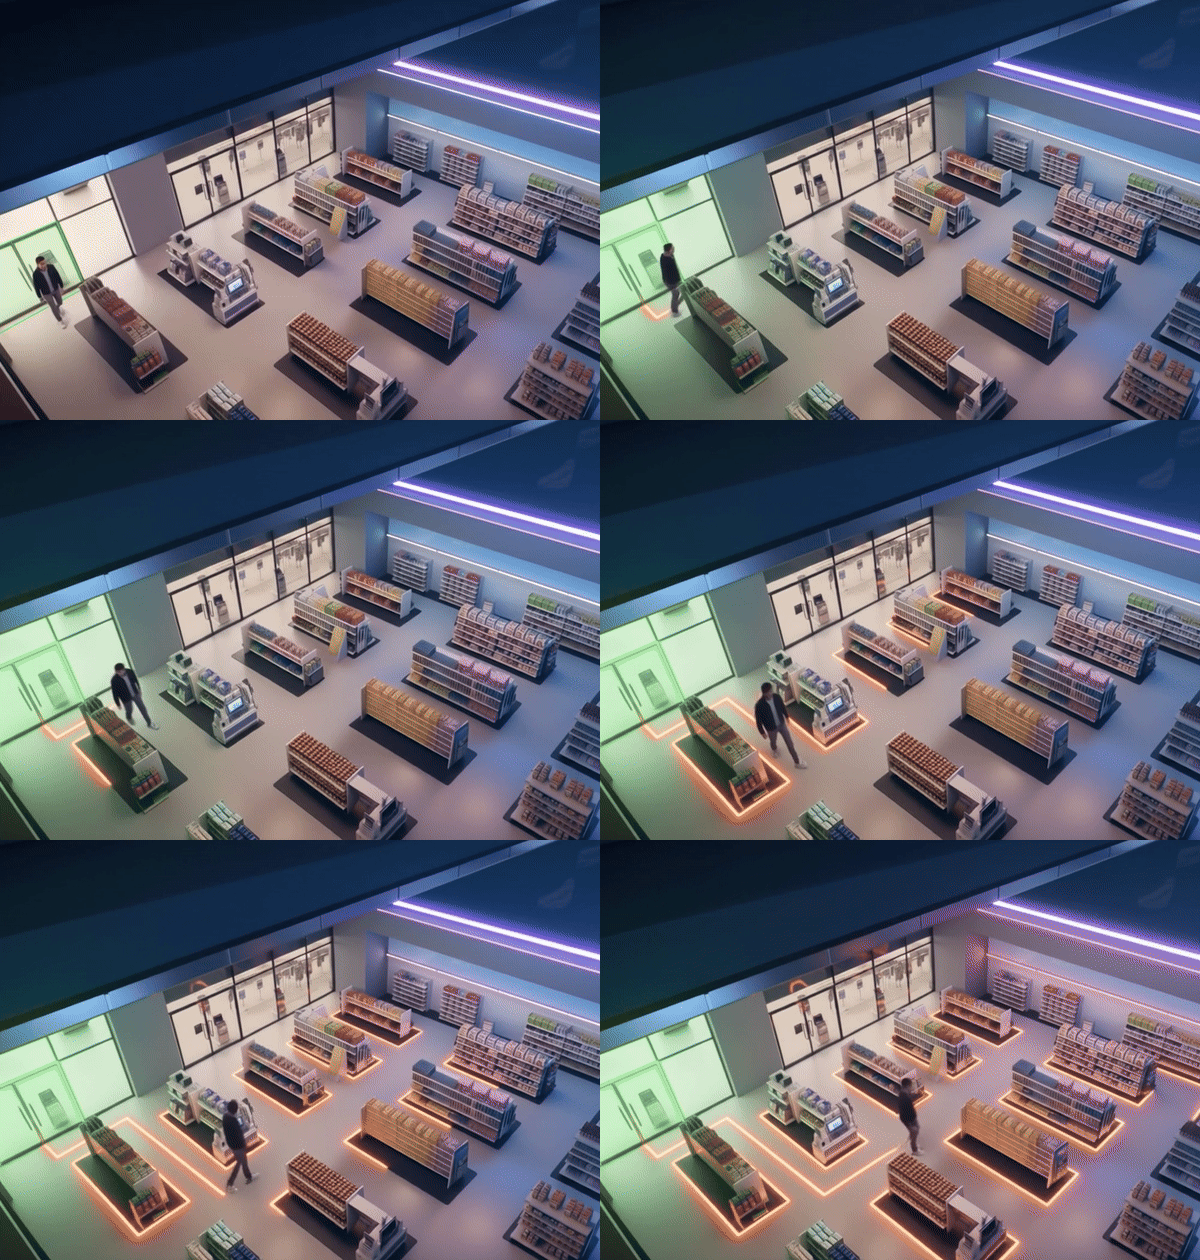
Set the zones that matter, measure everything inside them
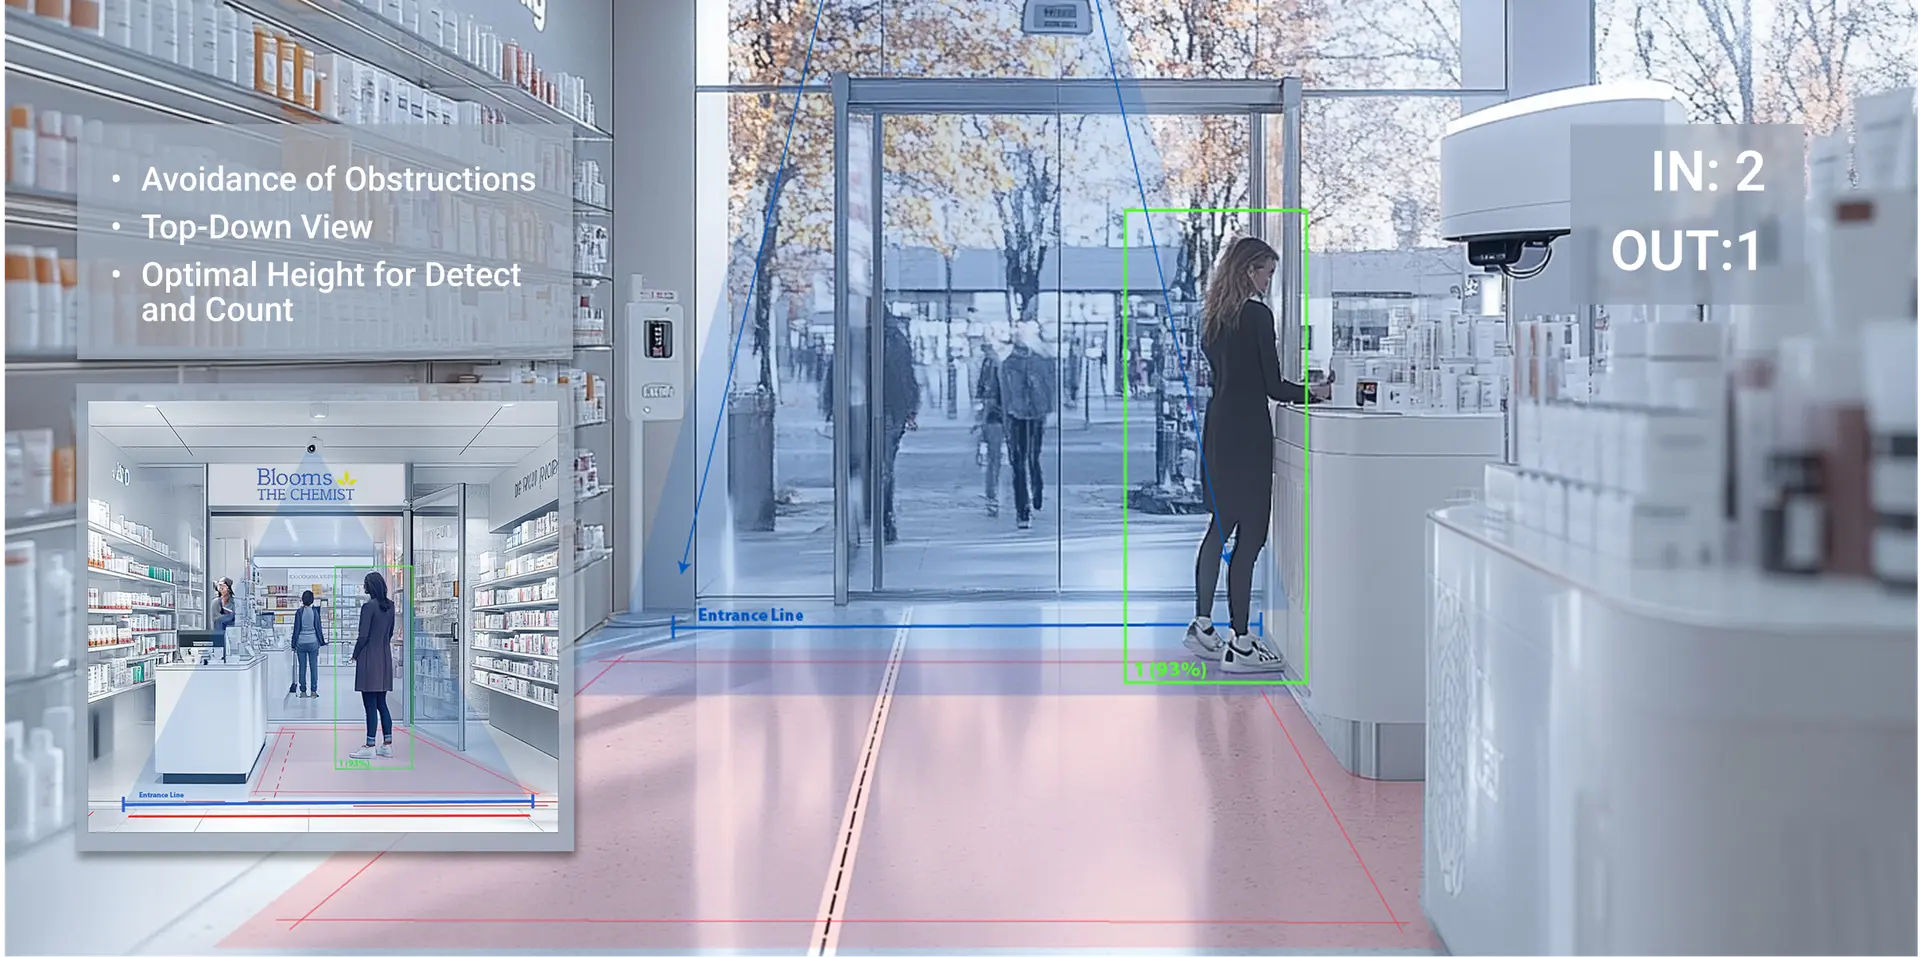
Draw the areas you care about straight onto your camera feeds — entrance, apparel, promo aisle, checkout — and the analytics start reporting against them. No new hardware on the floor, no manual counting.
It runs on the Samurai Suite: Shogun measures what happens in each zone, while Ronin watches the cameras and servers behind it. If a feed drops in one store, you know before it becomes a gap in the month's numbers.
THE CHALLENGE
In retail, what you can't see is already costing you.
You're making store decisions without the full picture
How customers move, where they stop, what they walk past — that data shapes better layouts, staffing and campaigns. Without it, you're guessing.
Your traffic numbers include your own team
Most counting systems can't tell a customer from a staff member walking the floor. If the number at the top of the report is wrong, every conversion rate below it is wrong too.
Queues form and nobody's measuring them
You know Saturday afternoons are busy. You don't know how long people actually wait, or at which counter — so rosters get set by habit rather than by demand.
Set the zones that matter, measure everything inside them
Draw the areas you care about straight onto your camera feeds — entrance, apparel, promo aisle, checkout — and the analytics start reporting against them. No new hardware on the floor, no manual counting.
It runs on the Samurai Suite: Shogun measures what happens in each zone, while Ronin watches the cameras and servers behind it. If a feed drops in one store, you know before it becomes a gap in the month's numbers.
Retail video analytics built on the cameras you already have
Art of Logic gives retailers and commercial operators clear visibility into how their spaces are used, day to day. Real-time video analytics measure customer movement, occupancy, dwell time and traffic patterns — so your team can see how each store actually performs, not how you assume it performs.
Retail video analytics built on the cameras you already have
Australia
Hailo-8 processor
with Ronin
deployment applications
Australia
Hailo-8 processor
with Ronin
deployment applications
Art of Logic gives retailers and commercial operators clear visibility into how their spaces are used, day to day. Real-time video analytics measure customer movement, occupancy, dwell time and traffic patterns — so your team can see how each store actually performs, not how you assume it performs.
Know exactly who's in your store, when, and where
Staffing schedules based on gut feel and layout decisions made without data cost retailers every day. Samurai Count delivers real-time footfall that automatically strips out staff, filters by age, and shows you exactly which zones customers visit and for how long.

Shogun — People Count
Tracks every customer entering, moving through, and leaving the store. Staff are automatically excluded from counts. Age-based filtering provides demographic breakdowns without storing personal data.
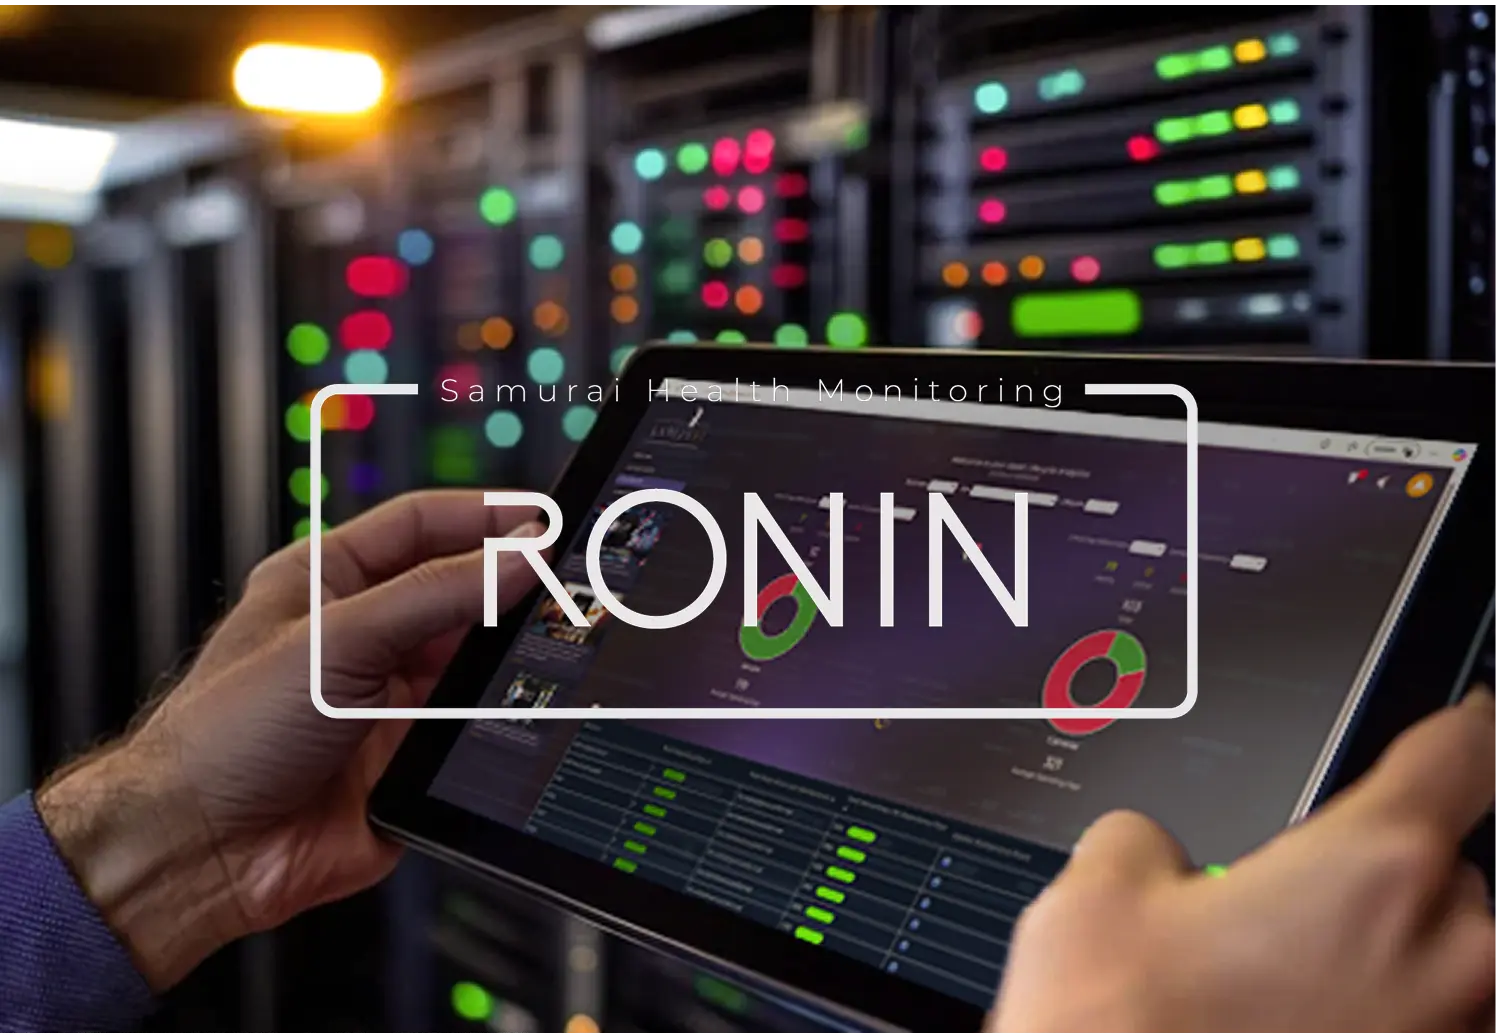
Ronin
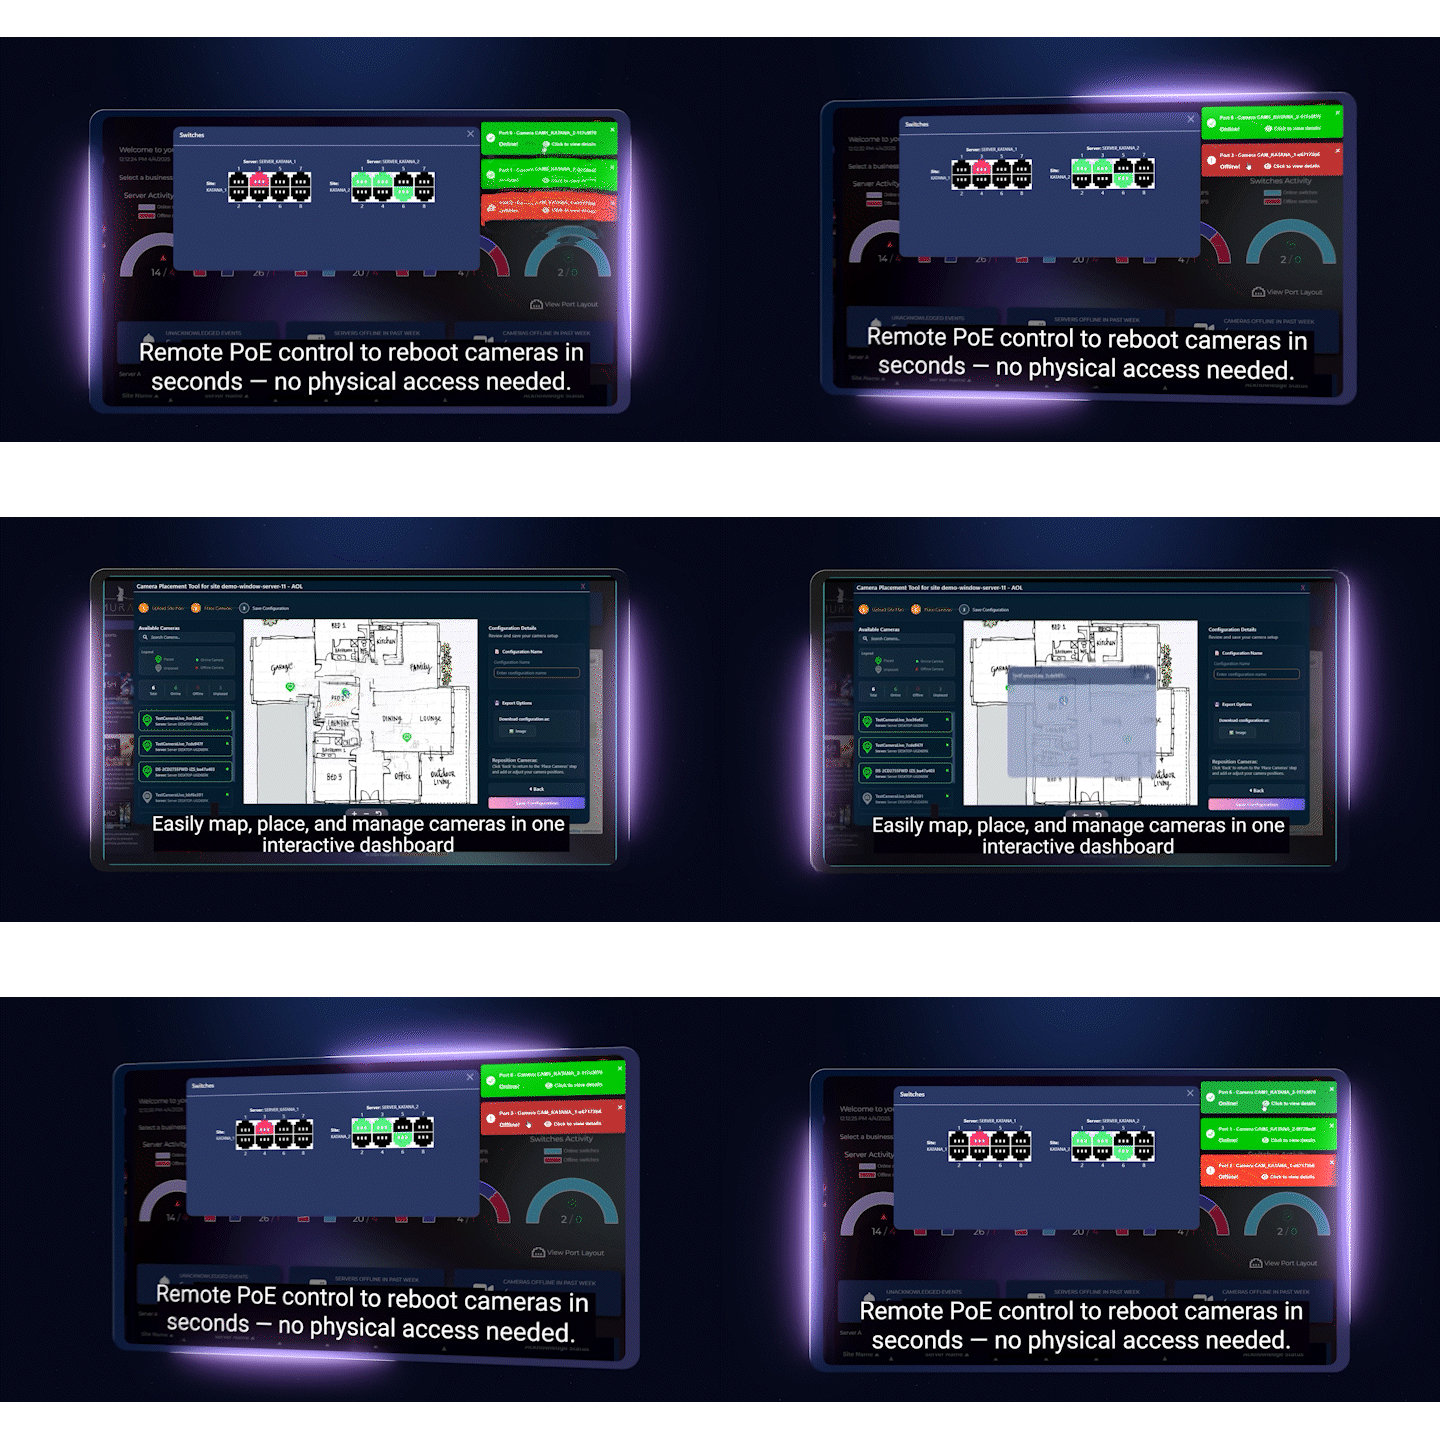
Monitors the health of every camera and analytics server across your store network. If a counting camera drops offline, Ronin flags it immediately — no gaps in your data.
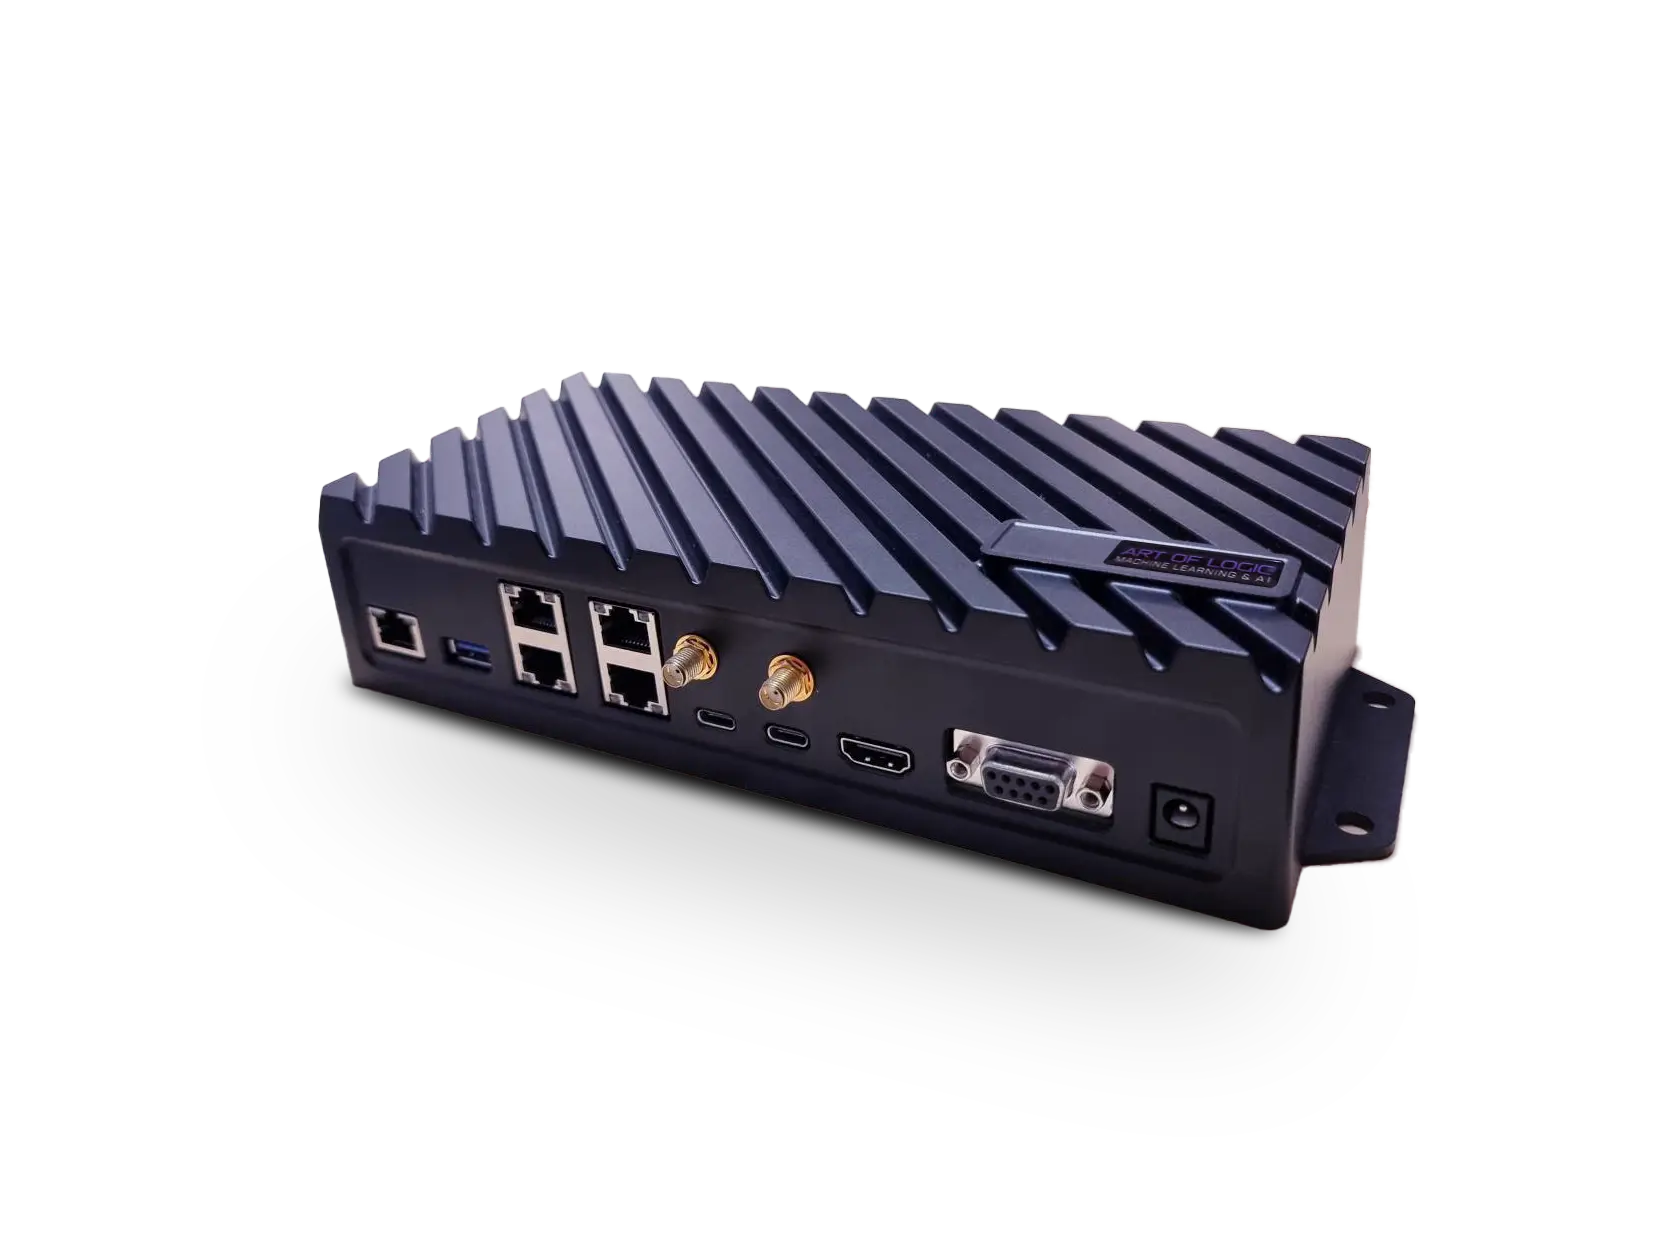
Hardware Callisto Ultra
Edge AI device engineered for continuous retail operation. Processes people counting analytics on-site with no cloud dependency — your data stays local.
Measure what your displays and end caps actually deliver
End cap placements, promotional zones, and product positioning decisions are expensive. Shogun's zone analytics give you impression counts, dwell time, and engagement rates per display so you can quantify ROI on every placement and pivot before the next planogram cycle.
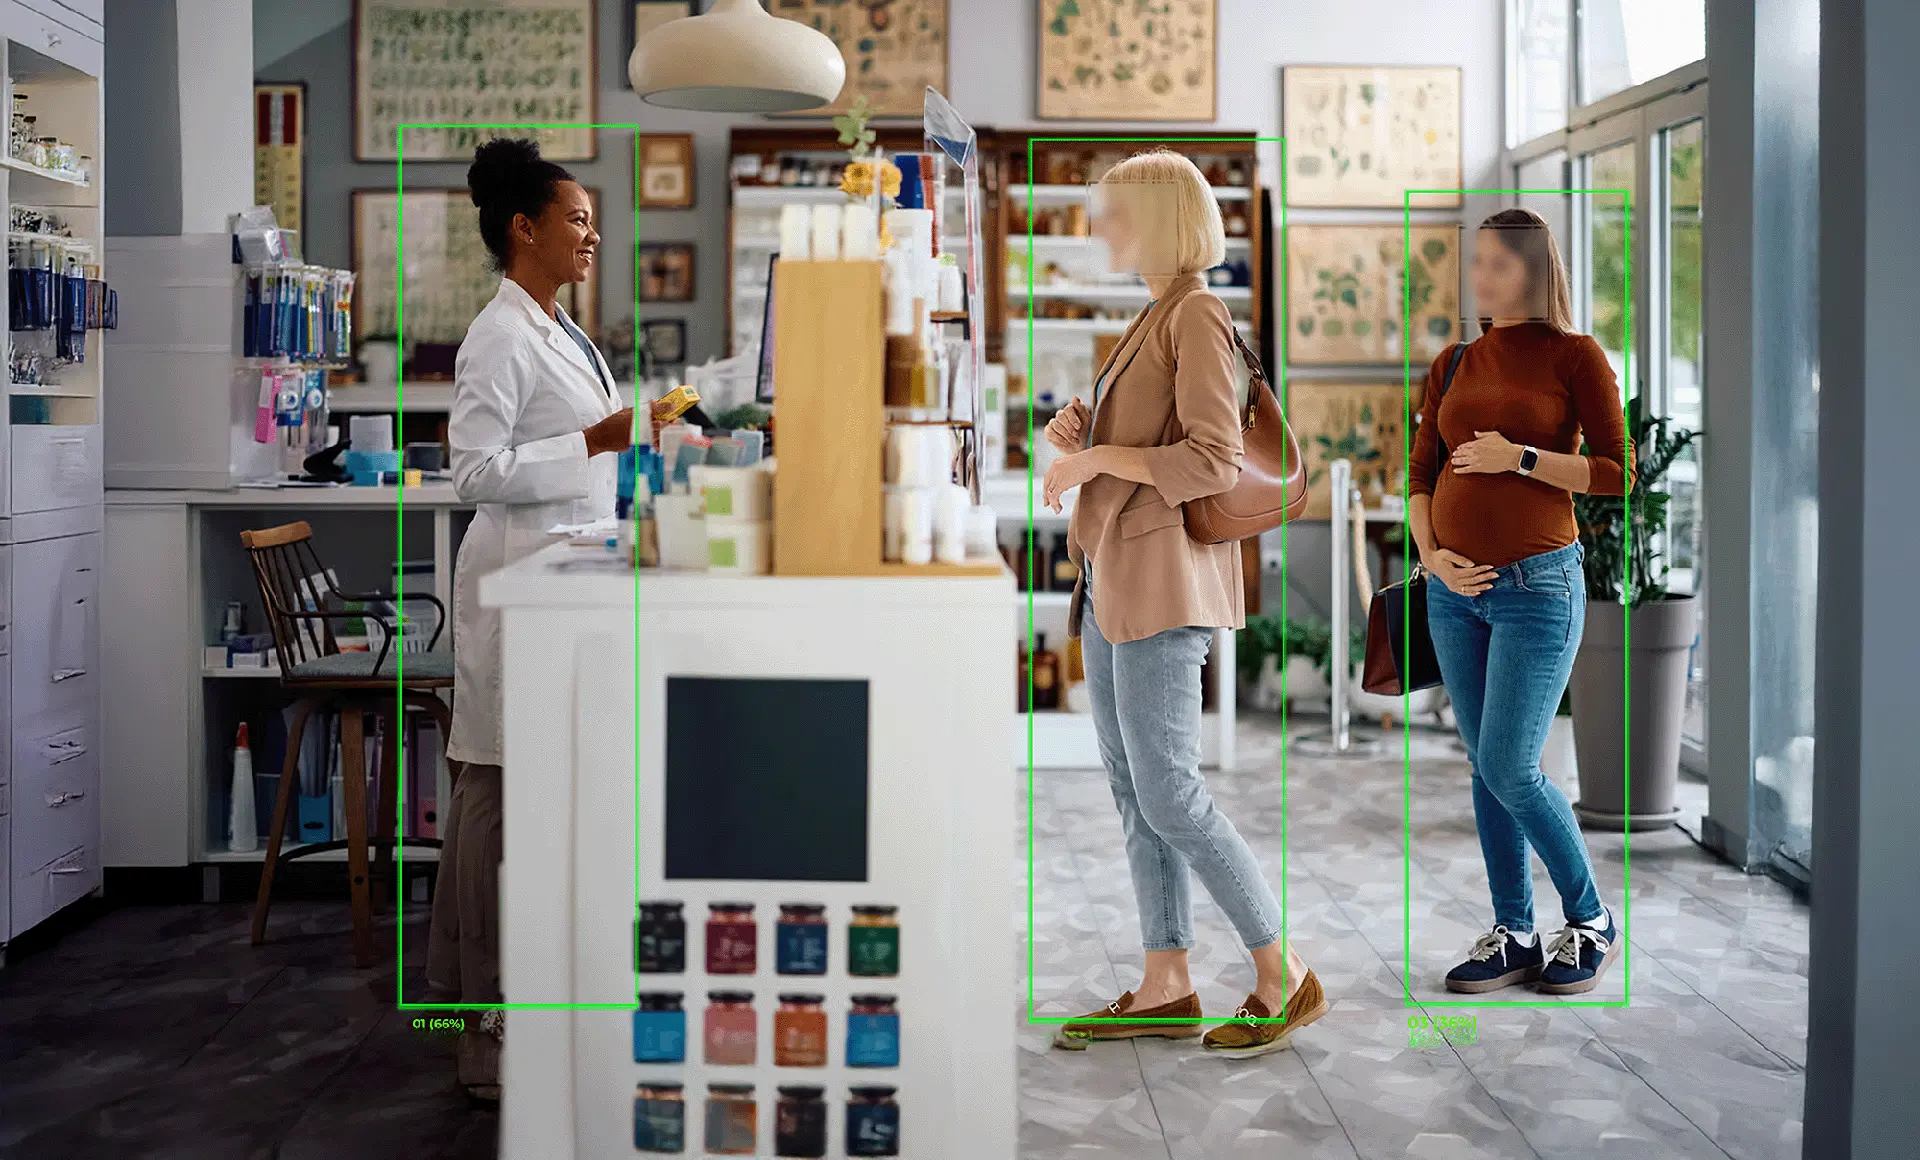
AI Video Analytics Shogun — Zone Analytics
Measures impressions, dwell time, and engagement per defined zone. Compare performance across end caps, feature displays, and product sections with no manual observation required.
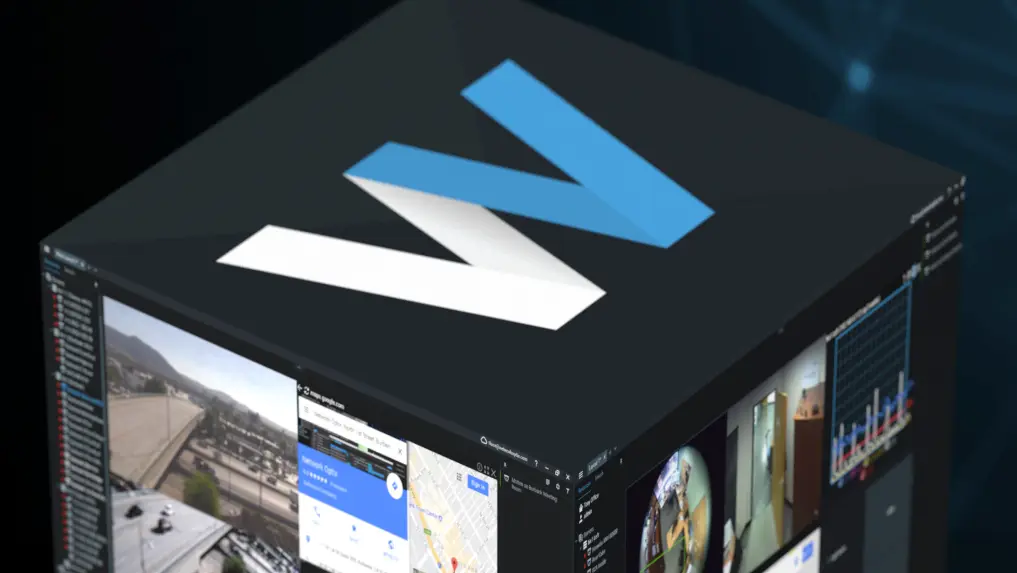
Video Management Nx Witness VMS
Multi-camera view with zone overlay visualisation and direct integration into the Samurai analytics dashboard. Review any zone event with instant clip retrieval.
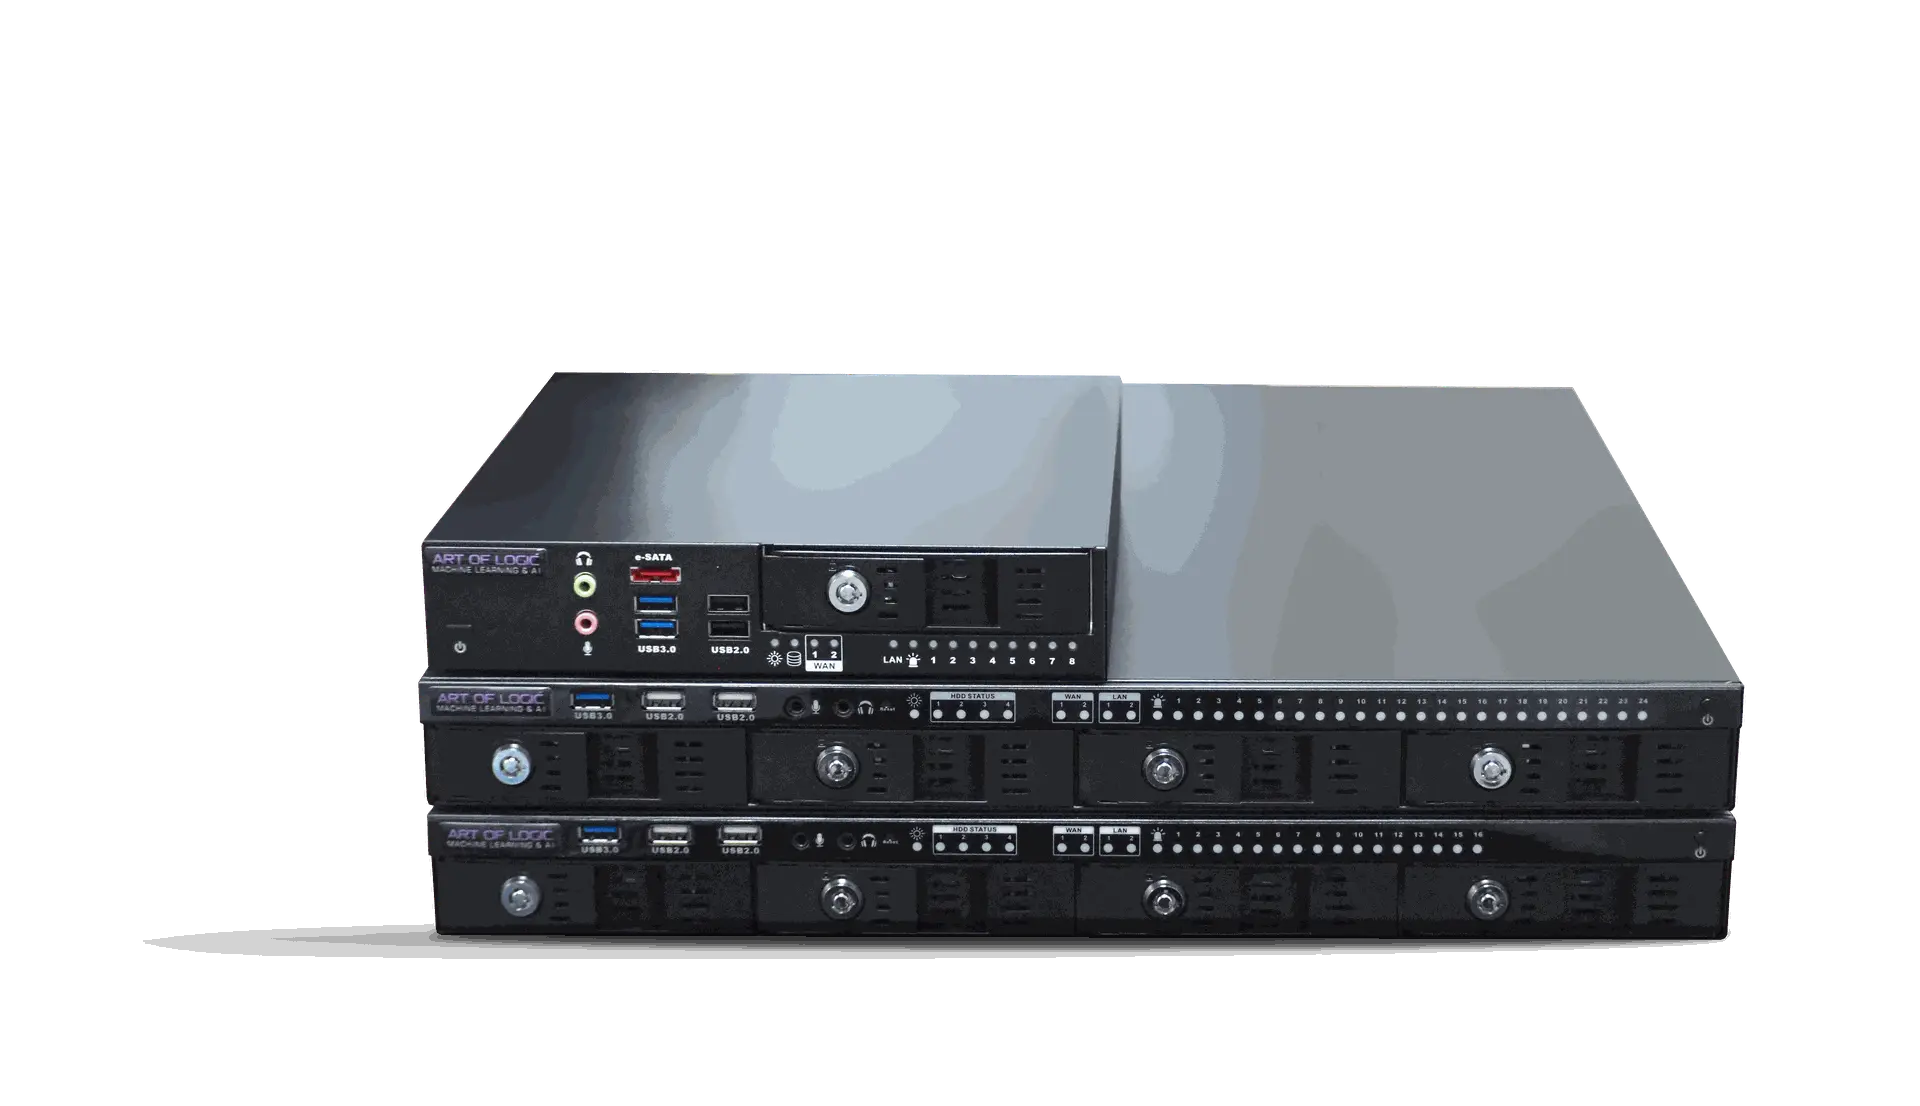
Hardware Katana Server
High-throughput server handling simultaneous analytics across every zone in a large-format store. Single rack unit processes multiple camera streams at once.
Understand the complete path from entrance to checkout
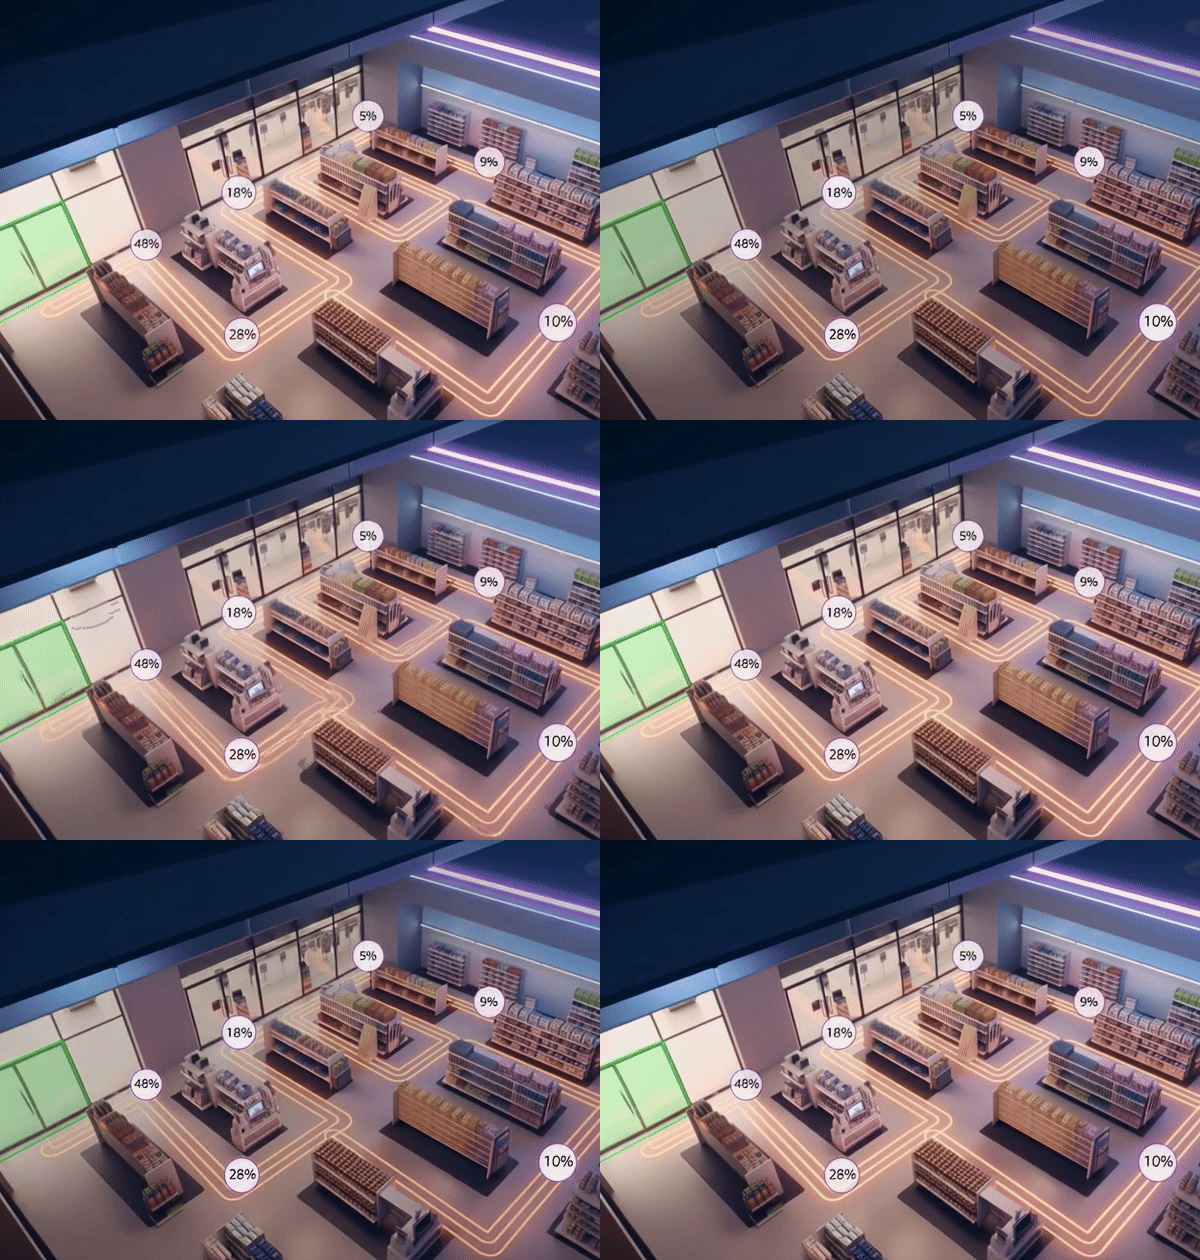
Re-ID analytics link anonymised customer sightings across every camera in the store, revealing the journeys people actually take. Which aisles do customers skip? Where do they go after picking up a product? What is the most common path to the checkout? This data reshapes planograms, marketing placement, and service positioning.
Re-ID Analytics Shogun — Re-ID
Follows anonymised individuals across multiple cameras to reconstruct complete in-store journeys. No facial recognition — privacy-safe Re-ID using appearance-based matching.
Analytics Platform Shogun
Dashboard aggregating journey data across all store sessions. Identify the most-walked paths, high-skip zones, and longest dwell points, updated continuously throughout the day.
Hardware Callisto Ultra
High-performance edge device running Re-ID models on-site. Journey analytics processed locally — customer movement data never leaves your facility.
Turn your car park into a customer intelligence asset
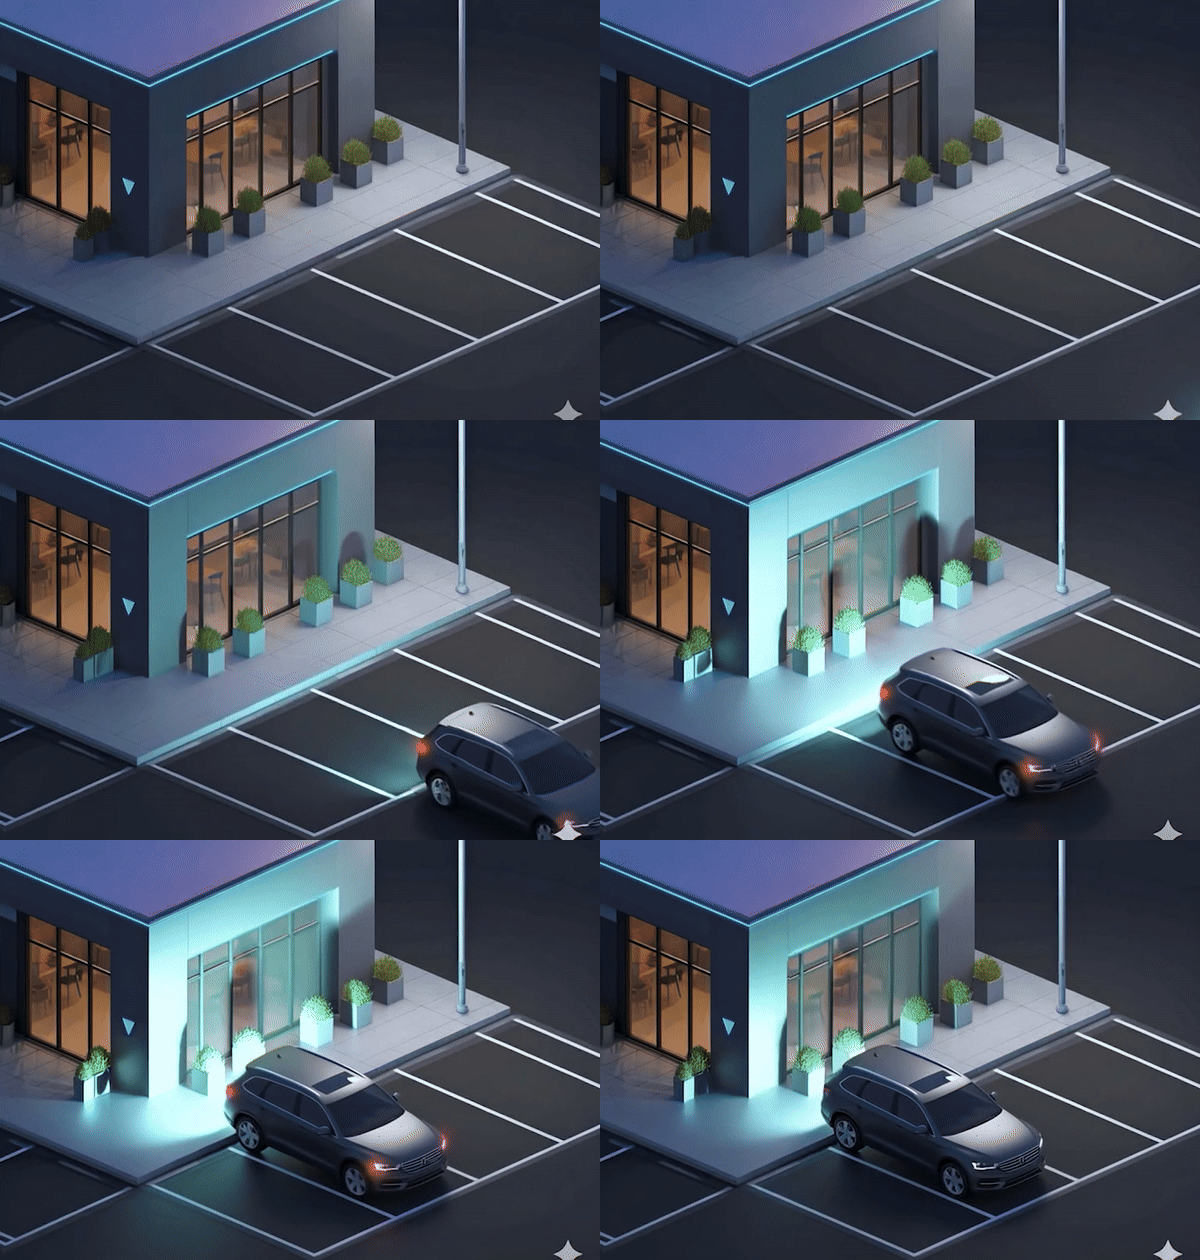
Your car park is one of the first touchpoints a customer has with your store — and most retailers have zero visibility into it. LPR analytics track entry, exit, occupancy, and repeat visit frequency. Pair it with in-store footfall to understand how parking availability and dwell time directly affect your sales.
Re-ID Analytics Shogun — Re-ID
Licence plate recognition at entry and exit points. Tracks vehicle dwell time, occupancy trends, and repeat visitor frequency. Every event is timestamped with plate image.
Analytics Platform Shogun
Monitors all LPR cameras and access infrastructure in real time. Downtime at an entry point is flagged before it creates a data gap or security exposure.
Hardware Katana Server
Processes multiple simultaneous LPR streams across entry, exit, and zone cameras. Handles large-format retail sites with high vehicle throughput.
Know exactly who's in your store, when, and where
Staffing schedules based on gut feel and layout decisions made without data cost retailers every day. Samurai Count delivers real-time footfall that automatically strips out staff, filters by age, and shows you exactly which zones customers visit and for how long.
Shogun — People Count
Tracks every customer entering, moving through, and leaving the store. Staff are automatically excluded from counts. Age-based filtering provides demographic breakdowns without storing personal data.
Ronin
Monitors the health of every camera and analytics server across your store network. If a counting camera drops offline, Ronin flags it immediately — no gaps in your data.
Hardware Callisto Ultra
Edge AI device engineered for continuous retail operation. Processes people counting analytics on-site with no cloud dependency — your data stays local.
Measure what your displays and end caps actually deliver
End cap placements, promotional zones, and product positioning decisions are expensive. Shogun's zone analytics give you impression counts, dwell time, and engagement rates per display so you can quantify ROI on every placement and pivot before the next planogram cycle.
AI Video Analytics Shogun — Zone Analytics
Measures impressions, dwell time, and engagement per defined zone. Compare performance across end caps, feature displays, and product sections with no manual observation required.
Video Management Nx Witness VMS
Multi-camera view with zone overlay visualisation and direct integration into the Samurai analytics dashboard. Review any zone event with instant clip retrieval.
Hardware Katana Server
High-throughput server handling simultaneous analytics across every zone in a large-format store. Single rack unit processes multiple camera streams at once.
Understand the complete path from entrance to checkout
Re-ID analytics link anonymised customer sightings across every camera in the store, revealing the journeys people actually take. Which aisles do customers skip? Where do they go after picking up a product? What is the most common path to the checkout? This data reshapes planograms, marketing placement, and service positioning.
Re-ID Analytics Shogun — Re-ID
Follows anonymised individuals across multiple cameras to reconstruct complete in-store journeys. No facial recognition — privacy-safe Re-ID using appearance-based matching.
Analytics Platform Shogun
Dashboard aggregating journey data across all store sessions. Identify the most-walked paths, high-skip zones, and longest dwell points, updated continuously throughout the day.
Hardware Callisto Ultra
High-performance edge device running Re-ID models on-site. Journey analytics processed locally — customer movement data never leaves your facility.
Turn your car park into a customer intelligence asset
Your car park is one of the first touchpoints a customer has with your store — and most retailers have zero visibility into it. LPR analytics track entry, exit, occupancy, and repeat visit frequency. Pair it with in-store footfall to understand how parking availability and dwell time directly affect your sales.
Re-ID Analytics Shogun — Re-ID
Licence plate recognition at entry and exit points. Tracks vehicle dwell time, occupancy trends, and repeat visitor frequency. Every event is timestamped with plate image.
Analytics Platform Shogun
Monitors all LPR cameras and access infrastructure in real time. Downtime at an entry point is flagged before it creates a data gap or security exposure.
Hardware Katana Server
Processes multiple simultaneous LPR streams across entry, exit, and zone cameras. Handles large-format retail sites with high vehicle throughput.
Measure what every display and end cap is actually worth
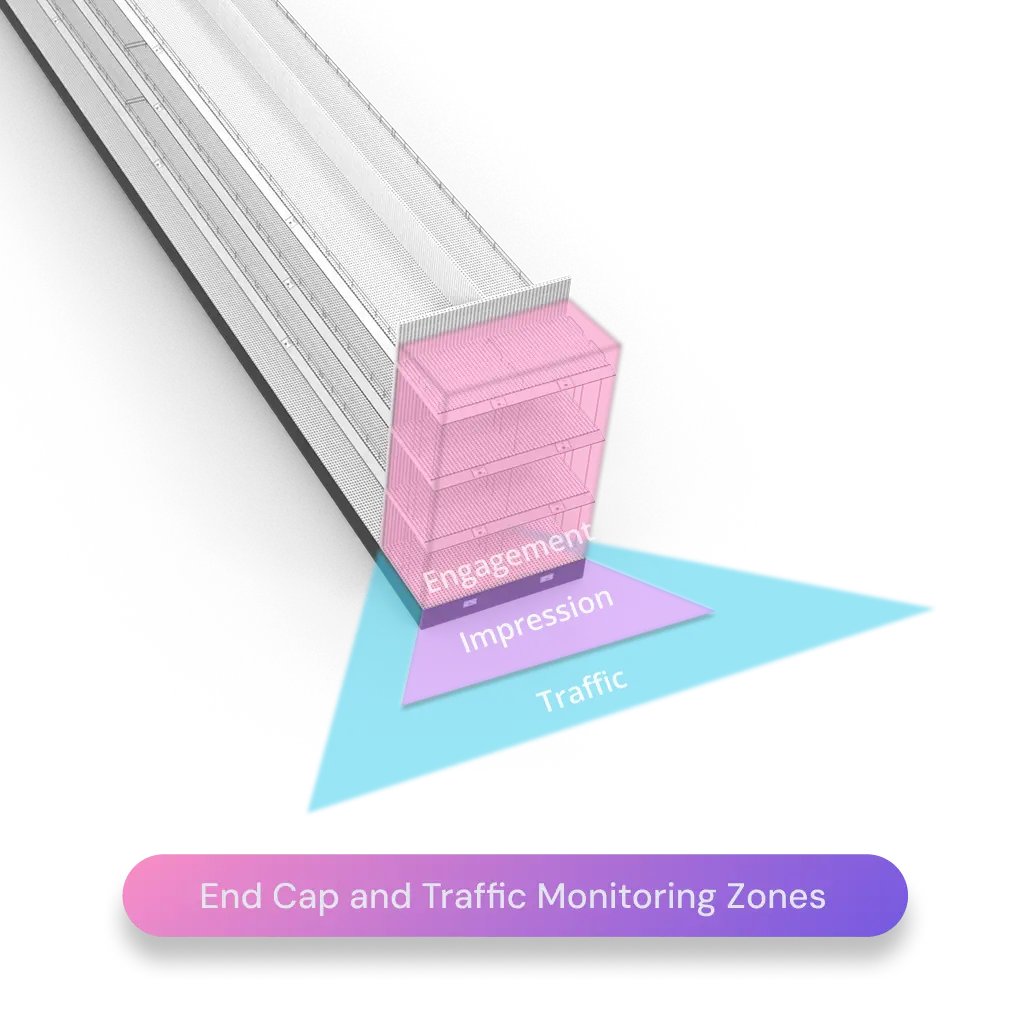
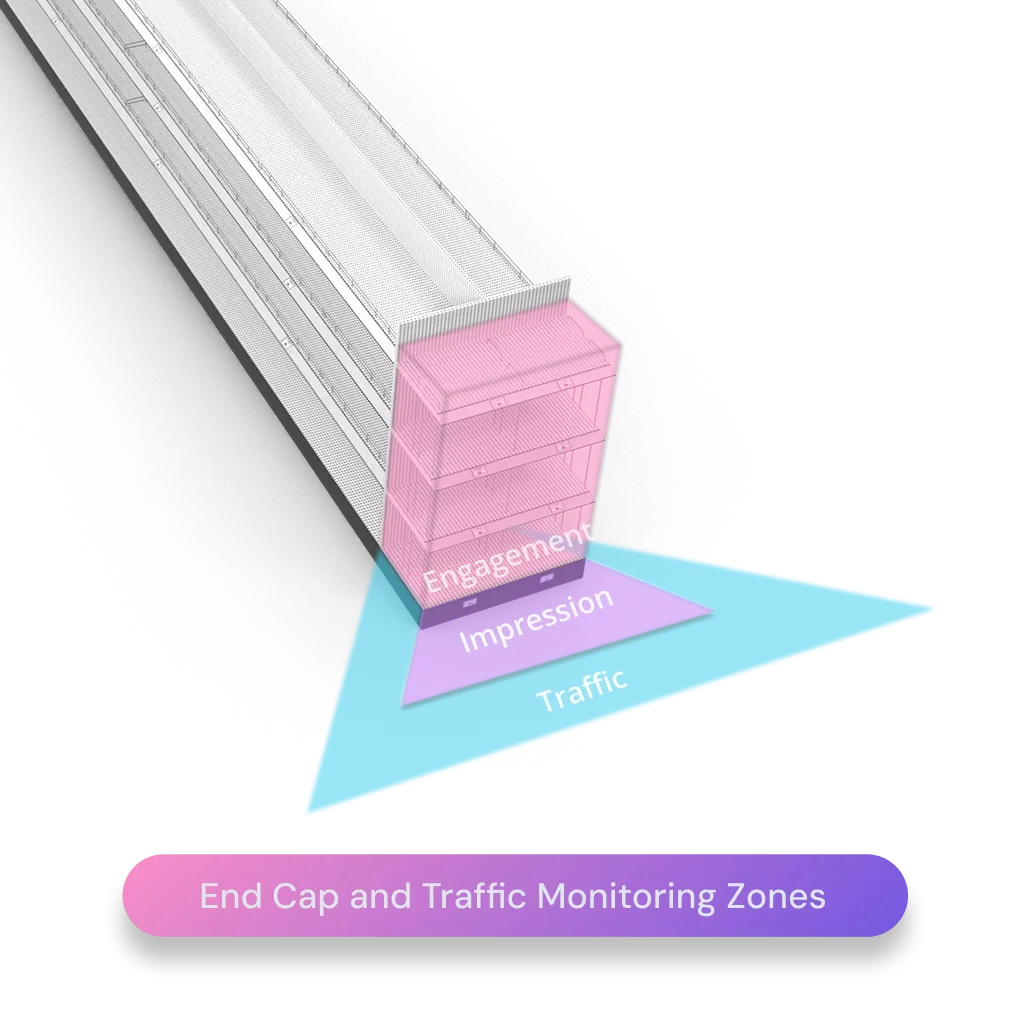
Measure the complete customer funnel at every product display and end cap. See exactly which placements drive engagement and which need optimization.
- Traffic: Count every customer who passes by the display area
- impression: Track how many stop to notice and look
- Engagement: Measure dwell time and product interaction
Run A/B tests on different layouts, compare premium vs. standard placements, and identify your highest-performing displays. Make data-driven merchandising decisions that increase conversion and maximize revenue per square meter
Measure what every display and end cap is actually worth
Measure the complete customer funnel at every product display and end cap. See exactly which placements drive engagement and which need optimization.
- Traffic: Count every customer who passes by the display area
- impression: Track how many stop to notice and look
- Engagement: Measure dwell time and product interaction
Run A/B tests on different layouts, compare premium vs. standard placements, and identify your highest-performing displays. Make data-driven merchandising decisions that increase conversion and maximize revenue per square meter
Contact usTurn every camera into a revenue generator Get Started With Your Site

Asset & Store Performance Insights
Understand how, when and why in-store assets are used — product displays, end caps, high-traffic zones, service counters. Retail teams get the data to review layout design, product placement and staffing against real customer behaviour rather than assumption.
Over time this supports better decisions about merchandising investment: which fixtures earn their footprint, which zones are underused, and where a change is worth making.
See the full customer journey
Re-ID analytics link the same anonymous shopper across every camera in your store — from entrance to checkout.
Asset Utilisation
Better understand how, when and why assets are being used to ensure councils provide great public spaces. Through our platform, data can be used to accurately design asset maintenance plans, cleaning schedules, and ensure assets are always useable.
This provides improved lifecycle management of assets. Rather than relying on industry models and forecasts, governments and asset owners can accurately determine the condition and life of an asset through usage patterns and behavior analysis.
Already running in councils, critical infrastructure and childcare centres
The analytics are proven. What's new is the retail build on top of them, store zones, customer journeys, and the reporting a retail team actually uses.

Already running in councils, critical infrastructure and childcare centres
The analytics are proven. What's new is the retail build on top of them, store zones, customer journeys, and the reporting a retail team actually uses.







Ready to Stop Guessing and Start Knowing?
Join the Australian retailers using video analytics to understand their customers and make better decisions about their stores every day.
Talk to an expert Start 30-day free trial Explore other solutions
Ready to Stop Guessing and Start Knowing?
Join Australian retailers using intelligent surveillance to protect stores and understand customers.